8  Participation

8.1 PART

Date Added : 2007-10-01

8.1.0.1 Definition

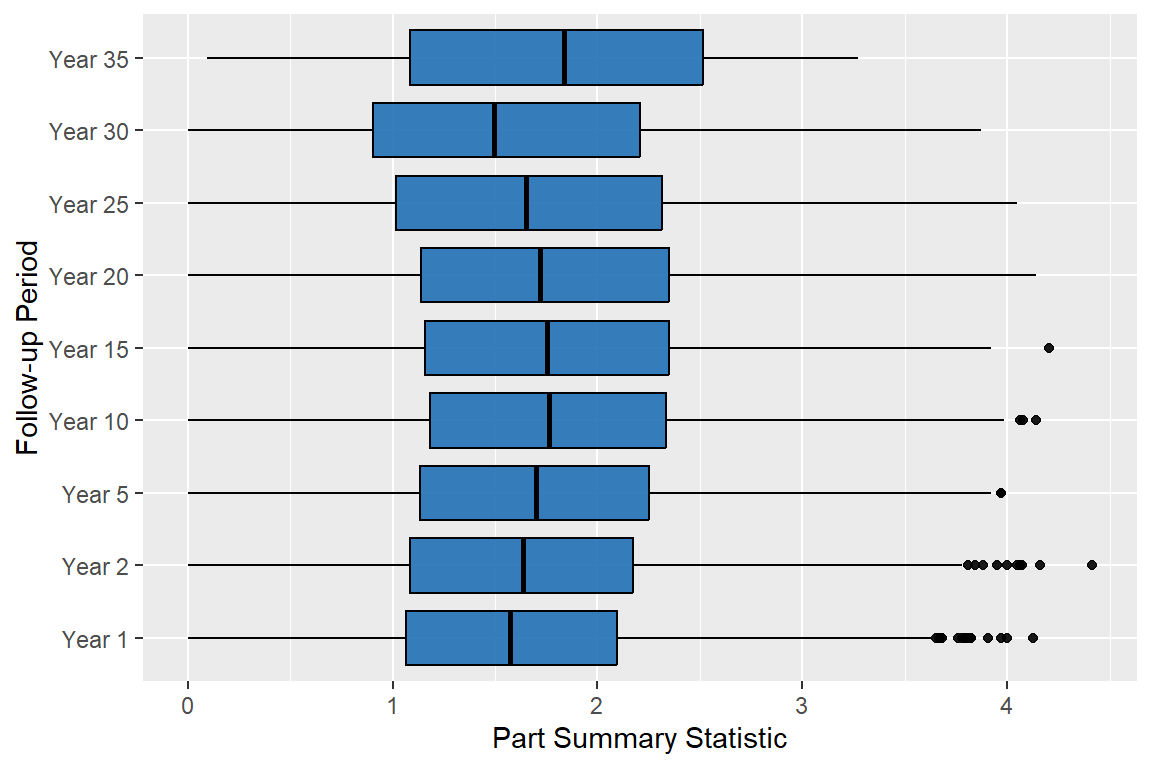
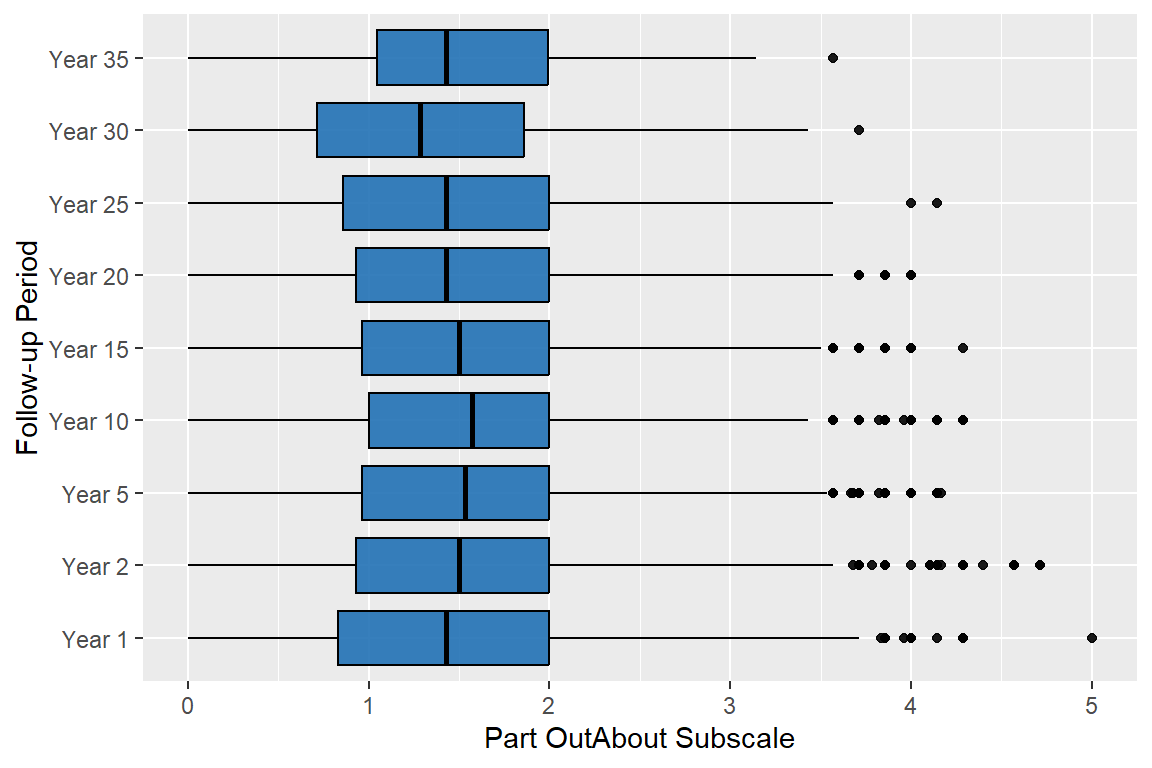
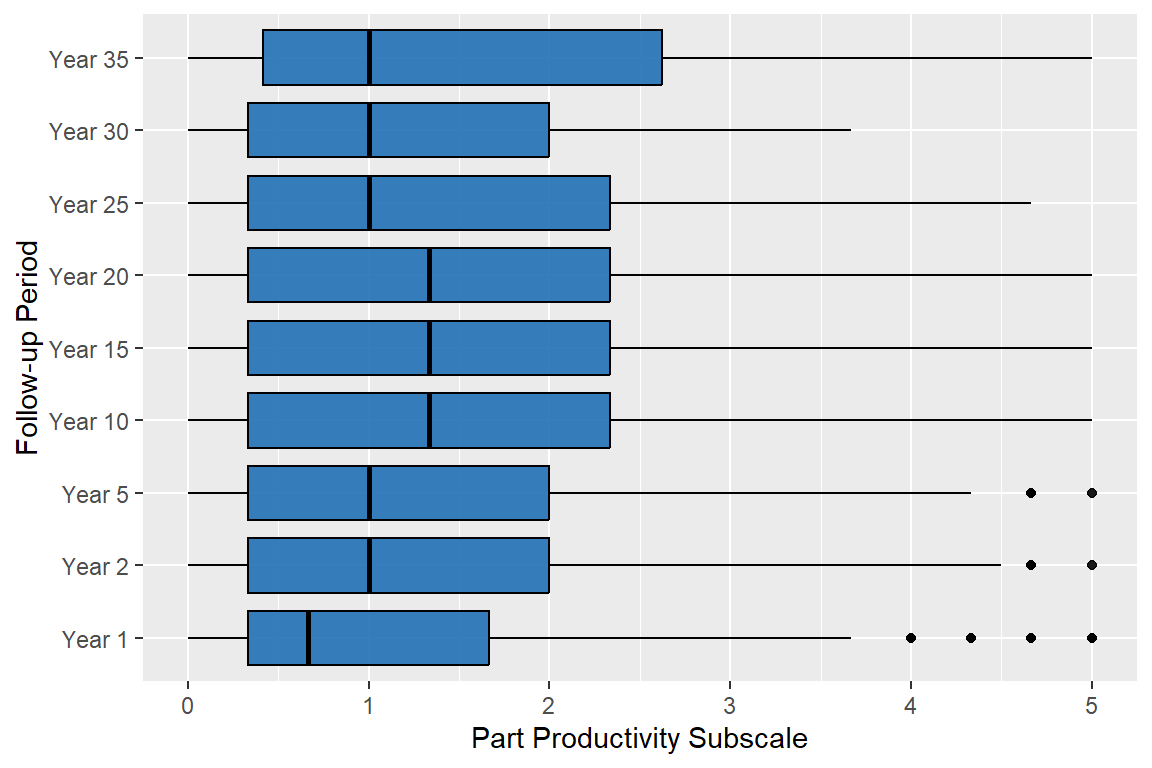
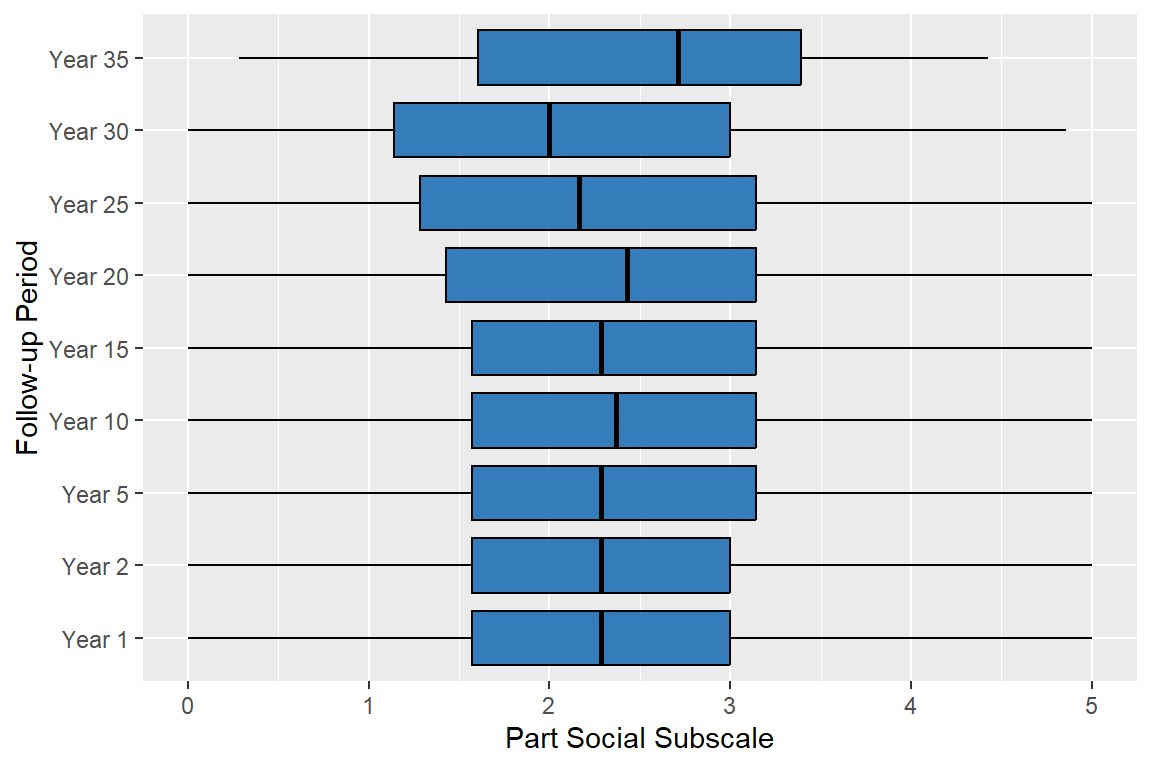
The Participation Assessment with Recombined Tools-Objective (PART-O) is an outcome scale measuring participation in the community. The PART-O consolidates questions from 3 commonly used instruments, and measures 3 domains of community participation post-rehabilitation: Productivity, Out and About, and Social Relations.

Form 1 - Only PART-O Productivity items and PART Volunteer are collected

8.1.0.2 Form

[X] Form 1
[X] Form 2

8.1.0.3 Details

See PART-O Manual link below for full administration and scoring guidelines.

8.1.0.4 Source

Interview, Mail-out (participant or proxy)

8.1.0.6 Characteristics

On 10/01/2017 the code for refused and unknown were switched to conform to coding standards.

Participant responses to these variables may be affected by the COVID-19 pandemic starting in March of 2020.

The PART-O score can accommodate missing variables ( a social score can be calculated if you have 3 of 5 variables), whereas the Rasch score needs complete data on all the measures (all variables need to have valid values). Therefore there are more missing Part-O Rasch calculated scores.

8.1.0.7 Training

Data Collectors should be familiar with the PART Training Manual (see Links) prior to administering the PART.

8.1.1 PART Summary

Part Summary Statistic
Characteristic Year 1
N = 11,995
Year 2
N = 11,233
Year 5
N = 9,928
Year 10
N = 7,644
Year 15
N = 4,825
Year 20
N = 2,469
Year 25
N = 875
Year 30
N = 255
Year 35
N = 39
Part Summary Statistic


    N Non-missing 11,482 10,704 9,499 7,325 4,621 2,352 824 233 34
    Mean (SD) 1.59 (0.73) 1.64 (0.74) 1.69 (0.75) 1.75 (0.77) 1.74 (0.79) 1.75 (0.80) 1.67 (0.83) 1.55 (0.80) 1.80 (0.89)
    Median (Q1, Q3) 1.58 (1.06, 2.10) 1.64 (1.09, 2.17) 1.70 (1.13, 2.25) 1.77 (1.18, 2.33) 1.75 (1.16, 2.35) 1.72 (1.14, 2.35) 1.65 (1.02, 2.32) 1.50 (0.90, 2.21) 1.84 (1.02, 2.53)
    Min, Max 0.00, 4.13 0.00, 4.41 0.00, 3.97 0.00, 4.14 0.00, 4.21 0.00, 4.14 0.00, 4.05 0.00, 3.87 0.10, 3.27
    Missing 513 529 429 319 204 117 51 22 5

96% of the interviewed people have valid data

8.1.2 PART Out and About

Date Added : 2007-10-01

8.1.2.1 Definition

Times per month out and about.

PRTVOL Prior to the injury, in a typical month, how many times do you do volunteer work?

PRTEatOutF: In a typical month, how many times do you eat in a restaurant?

PRTShopF: In a typical month, how many times do you go shopping? Include grocery shopping, as well as shopping for household necessities, or just for fun.

PRTPlaySportF: In a typical month, how many times do you engage in sports or exercise outside your home? Include activities like running, bowling, going to the gym, swimming, walking for exercise and the like.

PRTVolF: In a typical month, how many times do you do volunteer work?

PRTMovieF: In a typical month, how many times do you go to the movies?

PRTWtchSportF: In a typical month, how many times do you attend sports events in person, as a spectator?

PRTReligionF: In a typical month, how many times do you attend religious or spiritual services? Include places like churches, temples and mosques.

8.1.2.2 Characteristics

Students who live in a dorm and eat in a dorm cafeteria would count as eating in a restaurant.

The volunteer item does not contribute to score for subscales.

Part OutAbout Subscale
Characteristic Year 1
N = 11,995
Year 2
N = 11,233
Year 5
N = 9,928
Year 10
N = 7,644
Year 15
N = 4,825
Year 20
N = 2,469
Year 25
N = 875
Year 30
N = 255
Year 35
N = 39
Part OutAbout Subscale


    N Non-missing 11,513 10,724 9,523 7,349 4,636 2,356 827 233 34
    Mean (SD) 1.42 (0.79) 1.47 (0.78) 1.50 (0.77) 1.53 (0.76) 1.50 (0.76) 1.46 (0.76) 1.46 (0.79) 1.33 (0.76) 1.51 (0.88)
    Median (Q1, Q3) 1.43 (0.83, 2.00) 1.50 (0.93, 2.00) 1.54 (0.96, 2.00) 1.57 (1.00, 2.00) 1.50 (0.96, 2.00) 1.43 (0.93, 2.00) 1.43 (0.86, 2.00) 1.29 (0.71, 1.86) 1.43 (1.04, 2.00)
    Min, Max 0.00, 5.00 0.00, 4.71 0.00, 4.17 0.00, 4.29 0.00, 4.29 0.00, 4.00 0.00, 4.14 0.00, 3.71 0.00, 3.57
    Missing 482 509 405 295 189 113 48 22 5

96% of the interviewed people have valid data

8.1.3 PART Productivity

Date Added : 2007-10-01

8.1.3.1 Definition

Hours per week engaged in productive activities. Productivity Items;

PRTHomeF: In a typical week, how many hours do you spend in active homemaking, including cleaning, cooking and raising children?

PRTSchoolF: In a typical week, how many hours do you spend in school working toward a degree or in an accredited technical training program, including hours in class and studying?

PRTWorkF: In a typical week, how many hours do you spend working for money, whether in a job or self-employed?

8.1.3.2 Characteristics

Productivity items were added to Form 1 data collection on 4/1/2023

Part Productivity Subscale
Characteristic Year 1
N = 11,995
Year 2
N = 11,233
Year 5
N = 9,928
Year 10
N = 7,644
Year 15
N = 4,825
Year 20
N = 2,469
Year 25
N = 875
Year 30
N = 255
Year 35
N = 39
Part Productivity Subscale


    N Non-missing 11,669 10,862 9,651 7,427 4,697 2,393 846 246 38
    Mean (SD) 1.06 (0.97) 1.18 (1.00) 1.29 (1.02) 1.38 (1.03) 1.41 (1.05) 1.41 (1.04) 1.33 (1.04) 1.21 (1.00) 1.45 (1.20)
    Median (Q1, Q3) 0.67 (0.33, 1.67) 1.00 (0.33, 2.00) 1.00 (0.33, 2.00) 1.33 (0.33, 2.33) 1.33 (0.33, 2.33) 1.33 (0.33, 2.33) 1.00 (0.33, 2.33) 1.00 (0.33, 2.00) 1.00 (0.33, 2.67)
    Min, Max 0.00, 5.00 0.00, 5.00 0.00, 5.00 0.00, 5.00 0.00, 5.00 0.00, 5.00 0.00, 4.67 0.00, 3.67 0.00, 5.00
    Missing 326 371 277 217 128 76 29 9 1

97% of the interviewed people have valid data

8.1.4 PART Social

Date Added : 2007-10-01

8.1.4.1 Definition

Times per week engaged in social activities.

PRTSocFrndF: In a typical week, how many times do you socialize with friends, in person or by phone? Please do not include socializing with family members

PRTSocFamF: In a typical week, how many times do you socialize with family and relatives, in person or by phone?

PRTEmotSupF: In a typical week, how many times do you give emotional support to other people, that is, listen to their problems or help them with their troubles?

PRTInternetF: In a typical week, how many times do you use the Internet for communication with others? For example, text, email, virtual meetings, social media.?

8.1.4.2 Form

[ ] Form 1
[X] Form 2

8.1.4.3 Source

Form 2 - Interview, Mail-out (participant or proxy)

8.1.4.4 Characteristics

On 4/1/2022, the Internet question was updated from “In a typical week, how many times do you use the Internet for communication, such as for e-mail, visiting chat rooms or instant messaging?” to “In a typical week, how many times do you use the Internet for communication with others? For example, text, email, virtual meetings, social media.”

Part Social Subscale
Characteristic Year 1
N = 11,995
Year 2
N = 11,233
Year 5
N = 9,928
Year 10
N = 7,644
Year 15
N = 4,825
Year 20
N = 2,469
Year 25
N = 875
Year 30
N = 255
Year 35
N = 39
Part Social Subscale


    N Non-missing 11,517 10,747 9,540 7,354 4,640 2,363 827 234 34
    Mean (SD) 2.26 (1.02) 2.25 (1.03) 2.27 (1.06) 2.33 (1.10) 2.32 (1.12) 2.35 (1.13) 2.22 (1.18) 2.07 (1.20) 2.48 (1.13)
    Median (Q1, Q3) 2.29 (1.57, 3.00) 2.29 (1.57, 3.00) 2.29 (1.57, 3.14) 2.37 (1.57, 3.14) 2.29 (1.57, 3.14) 2.43 (1.43, 3.14) 2.17 (1.29, 3.14) 2.00 (1.14, 3.00) 2.71 (1.57, 3.43)
    Min, Max 0.00, 5.00 0.00, 5.00 0.00, 5.00 0.00, 5.00 0.00, 5.00 0.00, 5.00 0.00, 5.00 0.00, 4.86 0.29, 4.43
    Missing 478 486 388 290 185 106 48 21 5

96% of the interviewed people have valid data

8.1.5 Transportation

Date Added : 1989-10-01

8.1.5.1 Definition

Indicates the primary mode of motorized vehicular transportation, according to the best source of information (person with brain injury unless unavailable or unreliable).

8.1.5.2 Form

[ ] Form 1
[X] Form 2

8.1.5.3 Source

Form 2 - Interview, Mail-out (participant or proxy)

8.1.5.4 Details

Taxi, Uber and Lyft should be coded as ‘Public Transit’.

Electric scooters/E-bikes, as well as motorized wheelchairs should be coded as 1- Drives Vehicle.

Characteristic

Overall
N = 60,837

Year 1
N = 17,114

Year 2
N = 15,144

Year 5
N = 11,895

Year 10
N = 8,062

Year 15
N = 4,984

Year 20
N = 2,469

Year 25
N = 875

Year 30
N = 255

Year 35
N = 39

TransModeF, n (%)

Drives Vehicle

29,311 (51)

6,499 (40)

6,753 (47)

6,251 (55)

4,674 (60)

3,009 (63)

1,470 (63)

499 (60)

134 (55)

22 (61)

Rides with Someone Else

20,991 (36)

7,498 (46)

5,599 (39)

3,590 (32)

2,161 (28)

1,215 (25)

611 (26)

232 (28)

76 (31)

9 (25)

Public Transit

5,133 (8.8)

1,447 (8.9)

1,359 (9.4)

1,074 (9.4)

649 (8.4)

343 (7.1)

179 (7.6)

61 (7.4)

20 (8.2)

1 (2.8)

Special Bus or Van Service

2,573 (4.4)

770 (4.7)

689 (4.8)

464 (4.1)

271 (3.5)

235 (4.9)

89 (3.8)

37 (4.5)

14 (5.7)

4 (11)

Missing

2,829

900

744

516

307

182

120

46

11

3

95% of the interviewed people have valid data