Caution
:::t :::t Date Added : 2010-04-01
The Generalized Anxiety Disorder 2-item (GAD-2) is a brief initial screening tool for generalized anxiety disorder.
The full Generalized Anxiety Disorder Scale is a 7-item scale validated as a screener for anxiety disorder.
Participants are asked how often they have been bothered by the first 2 items from the list below over the last 2 week. If either is endorsed, the remaining items are asked.
[ ] Form 1
[X] Form 2
Interview, Mail-Out (participant only)
Interviewers should read the following introduction prior to administering the GAD: “Over the LAST 2 WEEKS, how often have you been bothered by the following problems?”
If either of the first 2 questions are coded either ‘1 - Several Days’, ‘2 - More Than Half Of The Days’, or ‘3 - Nearly Every Day’, then proceed to ask the remaining GAD items.
If both of the first 2 questions are coded ‘0 - Not at all’, code remaining GAD items as ‘81 - Not Applicable’ and skip to next section of interview.
The GAD should not be administered to a significant other, or any other proxy. If the individual is unable to provide data, use code ‘82. Not Applicable: No data from person with TBI’.
Every effort should be made to obtain the GAD assessment, however, if any items can not be assessed, use code ‘99. Unknown’. Do not leave blanks.
Participant responses to these variables may be affected by the COVID-19 pandemic starting in March of 2020.
On 4/1/2022, the GAD-2 Screener was implemented.
| Generalized Anxiety Disorder | |||||||||
| Characteristic | Year 1 N = 6,874 |
Year 2 N = 6,617 |
Year 5 N = 6,449 |
Year 10 N = 5,202 |
Year 15 N = 3,519 |
Year 20 N = 2,157 |
Year 25 N = 705 |
Year 30 N = 255 |
Year 35 N = 39 |
|---|---|---|---|---|---|---|---|---|---|
| GAD7TOTF | |||||||||
| N Non-missing | 5,082 | 4,952 | 5,058 | 4,233 | 2,871 | 1,784 | 571 | 208 | 32 |
| Mean (SD) | 3.7 (5.4) | 3.8 (5.4) | 3.8 (5.4) | 3.4 (5.1) | 3.3 (5.2) | 3.1 (5.0) | 3.0 (5.0) | 2.6 (4.6) | 2.2 (3.9) |
| Median (Q1, Q3) | 0.0 (0.0, 6.0) | 0.0 (0.0, 6.0) | 0.0 (0.0, 6.0) | 0.0 (0.0, 6.0) | 0.0 (0.0, 5.0) | 0.0 (0.0, 5.0) | 0.0 (0.0, 5.0) | 0.0 (0.0, 4.0) | 0.0 (0.0, 4.0) |
| Min, Max | 0.0, 21.0 | 0.0, 21.0 | 0.0, 21.0 | 0.0, 21.0 | 0.0, 21.0 | 0.0, 21.0 | 0.0, 21.0 | 0.0, 21.0 | 0.0, 15.0 |
| Missing | 1,792 | 1,665 | 1,391 | 969 | 648 | 373 | 134 | 47 | 7 |
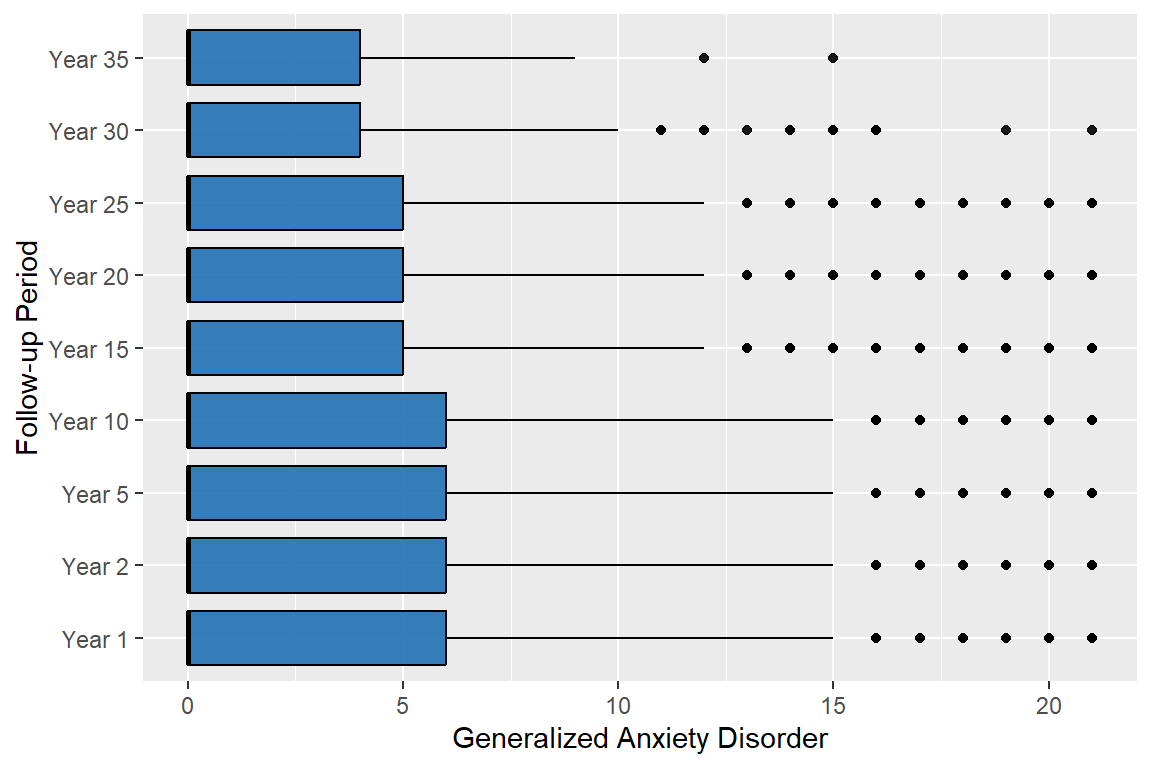
78% of the interviewed people have valid data
Date Added : 2010-04-01
The Patient Health Questionnaire-2 (PHQ-2) is a brief initial screening tool for depression.
The Patient Health Questionnaire-9 (PHQ-9) contains is a 9-item, patient self-report depression assessment.
Participants are asked how often they have been bothered by the first 2 items from the list below over the last 2 week. If either is endorsed, the remaining items are asked.
[ ] Form 1
[X] Form 2
Interview, Mail-Out (participant only)
Interviewers should read the following introduction prior to administering the PHQ: “Over the LAST 2 WEEKS, how often have you been bothered by the following problems?”
If either of the first 2 questions are coded either ‘1 - Several Days’, ‘2 - More Than Half Of The Days’, or ‘3 - Nearly Every Day’, then proceed to ask the remaining PHQ items.
If both of the first 2 questions are coded ‘0 - Not at all’, code remaining PHQ items as ‘81 - Not Applicable’ and skip to next section of interview.
The PHQ should not be administered to a significant other, or any other proxy. If the individual is unable to provide data, use code ‘82. Not Applicable: No data from person with TBI’.
Every effort should be made to obtain the PHQ assessments, however, if any items can not be assessed, use code ‘99. Unknown’. Do not leave blanks.
Participant responses to these variables may be affected by the COVID-19 pandemic starting in March of 2020.
On 4/1/2022, the PHQ-2 Screener was implemented.
| Patient Health Questionairre | |||||||||
| Characteristic | Year 1 N = 6,874 |
Year 2 N = 6,617 |
Year 5 N = 6,449 |
Year 10 N = 5,202 |
Year 15 N = 3,519 |
Year 20 N = 2,157 |
Year 25 N = 705 |
Year 30 N = 255 |
Year 35 N = 39 |
|---|---|---|---|---|---|---|---|---|---|
| PHQ9TOTF | |||||||||
| N Non-missing | 5,067 | 4,948 | 5,046 | 4,239 | 2,869 | 1,781 | 572 | 209 | 33 |
| Mean (SD) | 4.6 (6.2) | 4.7 (6.2) | 4.3 (6.1) | 4.0 (5.9) | 3.9 (5.7) | 3.6 (5.5) | 3.9 (5.7) | 3.5 (5.3) | 3.8 (7.1) |
| Median (Q1, Q3) | 1.0 (0.0, 8.0) | 1.0 (0.0, 8.0) | 0.0 (0.0, 8.0) | 0.0 (0.0, 7.0) | 0.0 (0.0, 7.0) | 0.0 (0.0, 6.0) | 0.0 (0.0, 7.0) | 0.0 (0.0, 6.0) | 0.0 (0.0, 6.0) |
| Min, Max | 0.0, 27.0 | 0.0, 27.0 | 0.0, 27.0 | 0.0, 27.0 | 0.0, 27.0 | 0.0, 27.0 | 0.0, 25.0 | 0.0, 27.0 | 0.0, 24.0 |
| Missing | 1,807 | 1,669 | 1,403 | 963 | 650 | 376 | 133 | 46 | 6 |
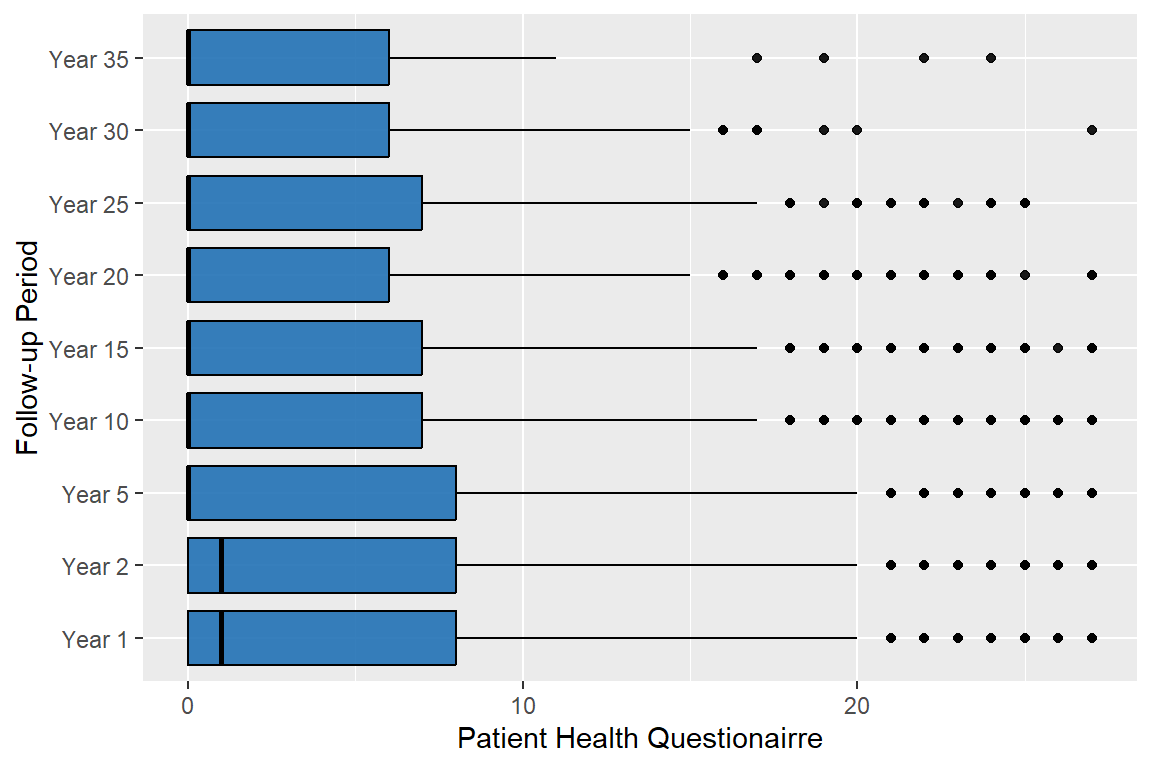
78% of the interviewed people have valid data
Date Added : 1997-01-01
The person with brain injury should rate his/her satisfaction with life at the time of the follow-up evaluation by indicating his/her level of agreement with the four questions below.
For more information, see Links
[ ] Form 1
[X] Form 2
Interview, Mail-Out (Participant only)
Do not embellish when obtaining this information.
If appropriate, when a participant questions what is meant by the word “ideal”, use the cue “best” or “best possible” or “whatever ideal means to you.”
Introduction to the SWLS (COMBI)
SWLS Frequently Asked Questions/Tips (COMBI)
SWLS Spanish Translation
Diener E, Emmons R, Larsen J, Griffin S. (1985). The Satisfaction With Life Scale. J Personality Assessment, 49(1), 71-75.
Pavot W, Deiner E. (1993). Review of the Satisfaction With Life Scale. Psychological Assessment. 5(3), 164-172.
In 2003, the TBIMS had difficulty obtaining this information (11% missing data). Five Model Systems had missing data rates of 10% or more. Data managers report that missing data are due to some persons with TBI being unable to provide information for the Form II, combined with the requirement that the SWLS must not be answered by anyone other than the person with TBI. A new code was been added to this item to identify these cases.
Participant responses to these variables may be affected by the COVID-19 pandemic starting in March of 2020.
| Satisfaction with Life Scale | |||||||||
| Characteristic | Year 1 N = 16,689 |
Year 2 N = 14,818 |
Year 5 N = 11,787 |
Year 10 N = 8,062 |
Year 15 N = 4,984 |
Year 20 N = 2,469 |
Year 25 N = 875 |
Year 30 N = 255 |
Year 35 N = 39 |
|---|---|---|---|---|---|---|---|---|---|
| SWLSTOT4F | |||||||||
| N Non-missing | 12,786 | 11,541 | 9,418 | 6,610 | 4,122 | 2,061 | 721 | 211 | 33 |
| Mean (SD) | 17 (7) | 18 (7) | 18 (7) | 18 (7) | 18 (7) | 19 (7) | 18 (7) | 18 (6) | 18 (7) |
| Median (Q1, Q3) | 18 (12, 23) | 19 (12, 24) | 20 (13, 24) | 20 (13, 24) | 20 (13, 24) | 20 (14, 24) | 19 (14, 24) | 19 (13, 24) | 20 (12, 24) |
| Min, Max | 4, 28 | 4, 28 | 4, 28 | 4, 28 | 4, 28 | 4, 28 | 4, 28 | 4, 28 | 4, 28 |
| Missing | 3,903 | 3,277 | 2,369 | 1,452 | 862 | 408 | 154 | 44 | 6 |
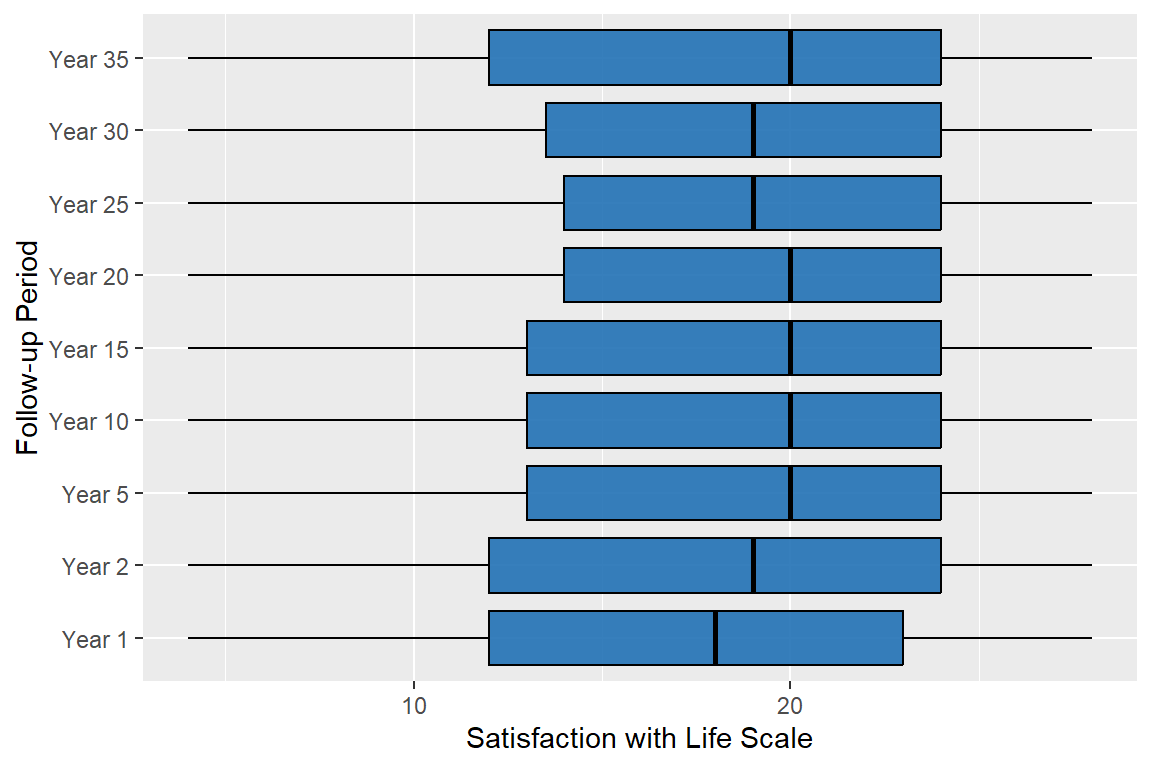
79% of the interviewed people have valid data